
Mortgage rates in Canada shift constantly, and even a small difference can cost you thousands over the life of your loan. We at Financial Canadian built this guide to help you compare mortgage rates Canada and understand what actually moves the needle on your monthly payments.
The right rate depends on your situation-your credit score, down payment, and how long you plan to stay in your home all matter. We’ll walk you through the tools, strategies, and real numbers you need to lock in a competitive deal.
Current Mortgage Rates in Canada Right Now
As of July 28, 2026, the Bank of Canada prime rate sits at 4.45%, which directly shapes what you’ll pay on variable mortgages. The lowest insured 5-year fixed rates hover around 3.94%, while 5-year variable rates start at 3.25% according to current market data. These rates represent a meaningful drop from pandemic-era peaks in 2023, when the Bank of Canada pushed rates to 5% before cutting them through 2024 and 2025. If you shop now, you face a much different landscape than borrowers encountered two years ago, though rates remain elevated compared to the historic lows of 2021 and 2022. The gap between fixed and variable has narrowed significantly, which means your choice between the two hinges less on rate spread and more on your risk tolerance and your timeline for staying in your home.
Regional Differences Shape Your Options
Regional differences matter far more than most borrowers realize. Ontario, Quebec, British Columbia, and Alberta each have distinct lender competition and local market dynamics that push rates up or down. Major lenders like the Big Six banks quote around 3.89% for 3-year fixed mortgages, but brokers and alternative lenders often undercut these posted rates by 0.30% to 0.50% or more. The spread between insured mortgages (which require mortgage default insurance for down payments under 20%) and uninsured mortgages is stark. Insured products at 3.94% for 5-year fixed cost less than uninsured options, which can sit 0.30% to 0.50% higher, making the insurance premium worth paying if your down payment falls short of 20%. This reality catches most borrowers off guard: putting down exactly 20% doesn’t always save money once you factor in the higher uninsured rate you’ll receive.
Your Credit Score and Down Payment Control Your Rate
Your credit score, down payment size, and income stability determine whether you qualify for posted rates or better. Lenders reserve their lowest rates for borrowers with credit scores above 720, stable employment, and minimal debt. A 5% down payment on a first home typically qualifies you for insured rates around 3.94%, while a 20% down payment might get you 4.04% as an uninsured product, making the insured route financially superior.
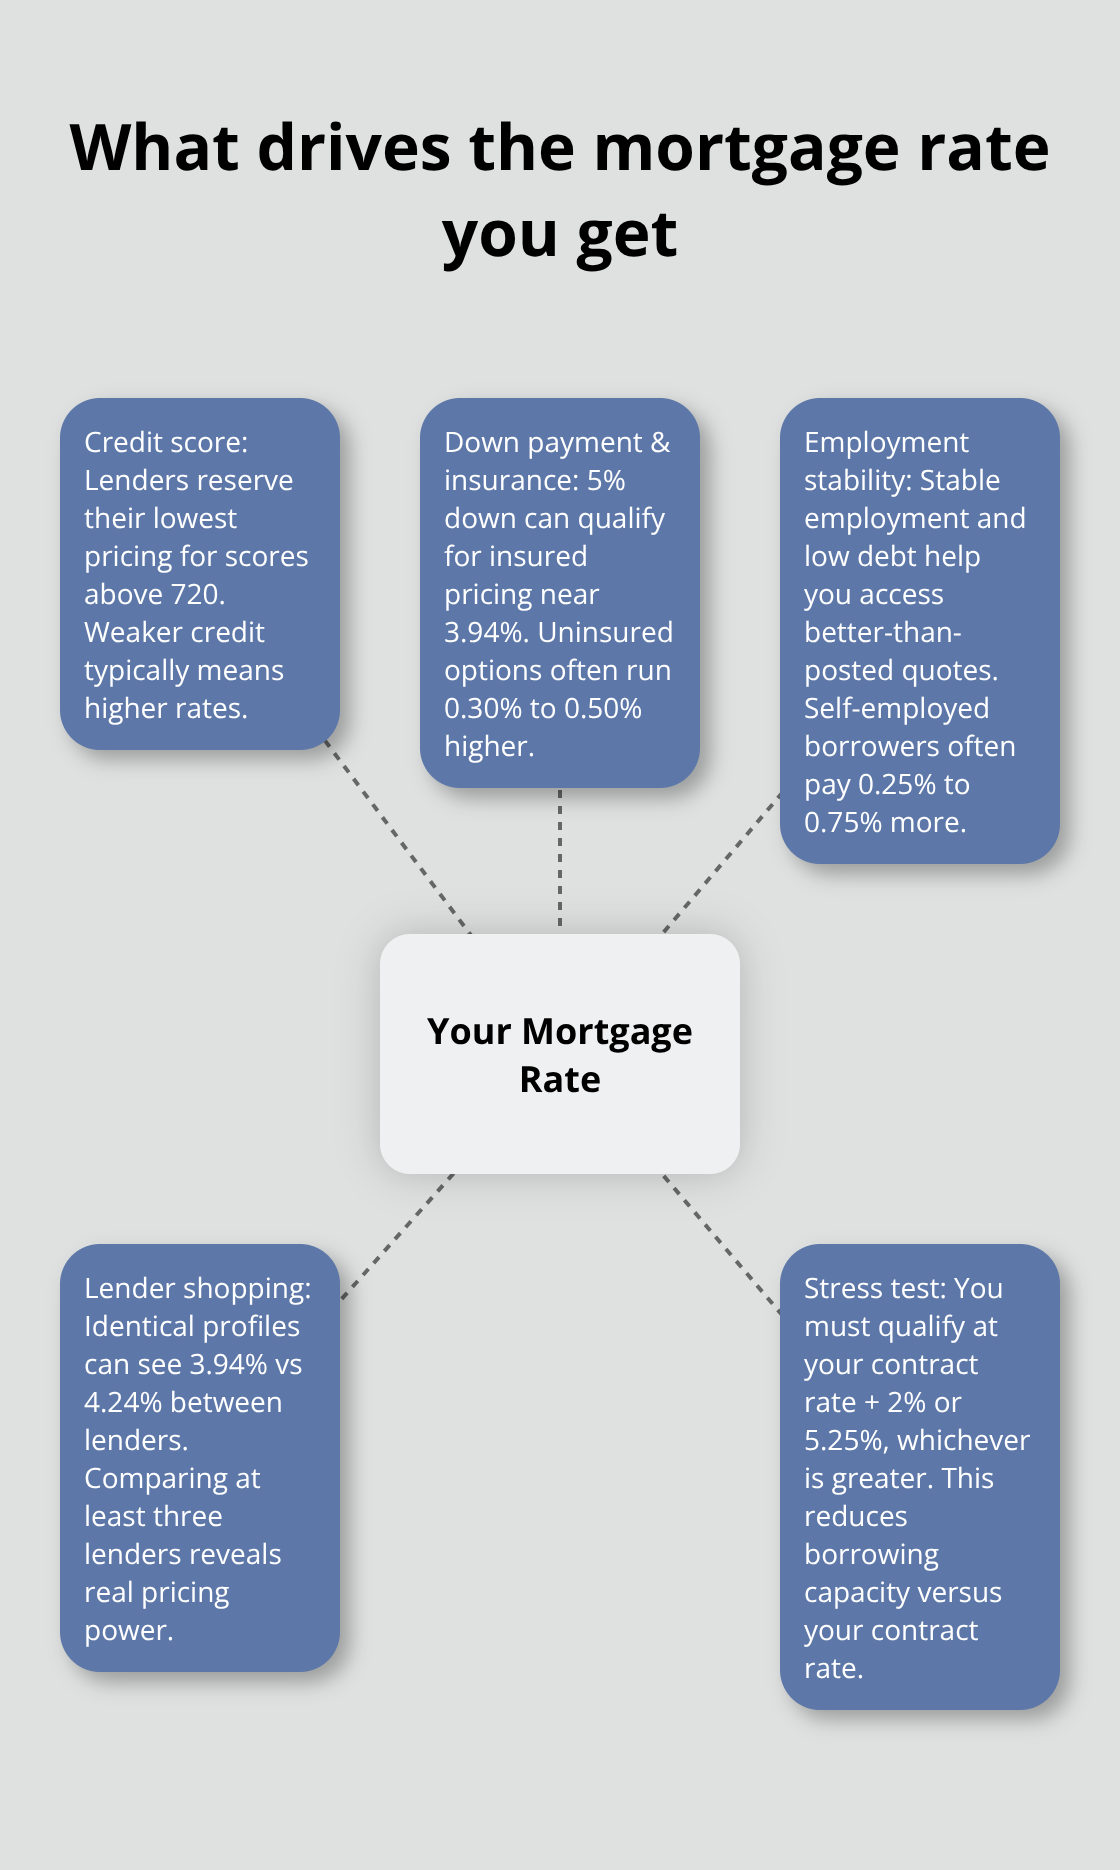
Self-employed borrowers face stricter documentation and often pay 0.25% to 0.75% more due to income verification complexity. The stress test requirement qualifying rate is the greater of your mortgage contract rate plus 2% or 5.25%, which means your actual borrowing capacity is lower than it appears (this gap widens as rates climb). Shopping with multiple lenders reveals real pricing power; one lender might offer 3.94% while another quotes 4.24% for identical scenarios, making comparison absolutely non-negotiable.
Why Comparison Tools Matter More Than Posted Rates
Posted rates from bank websites rarely reflect what you’ll actually pay. Brokers and online comparison platforms access rates that undercut posted quotes by significant margins. The difference between the highest and lowest available rates for your profile can easily reach 0.50% or more, which translates to thousands of dollars over your mortgage term. Rates update multiple times daily across different lenders, so a quote you received yesterday may no longer represent the best available option. Your next step involves testing your profile against multiple lenders to see where you actually stand and what rate you can lock in.
Which Mortgage Type Matches Your Financial Situation
Fixed-Rate vs Variable-Rate Mortgages
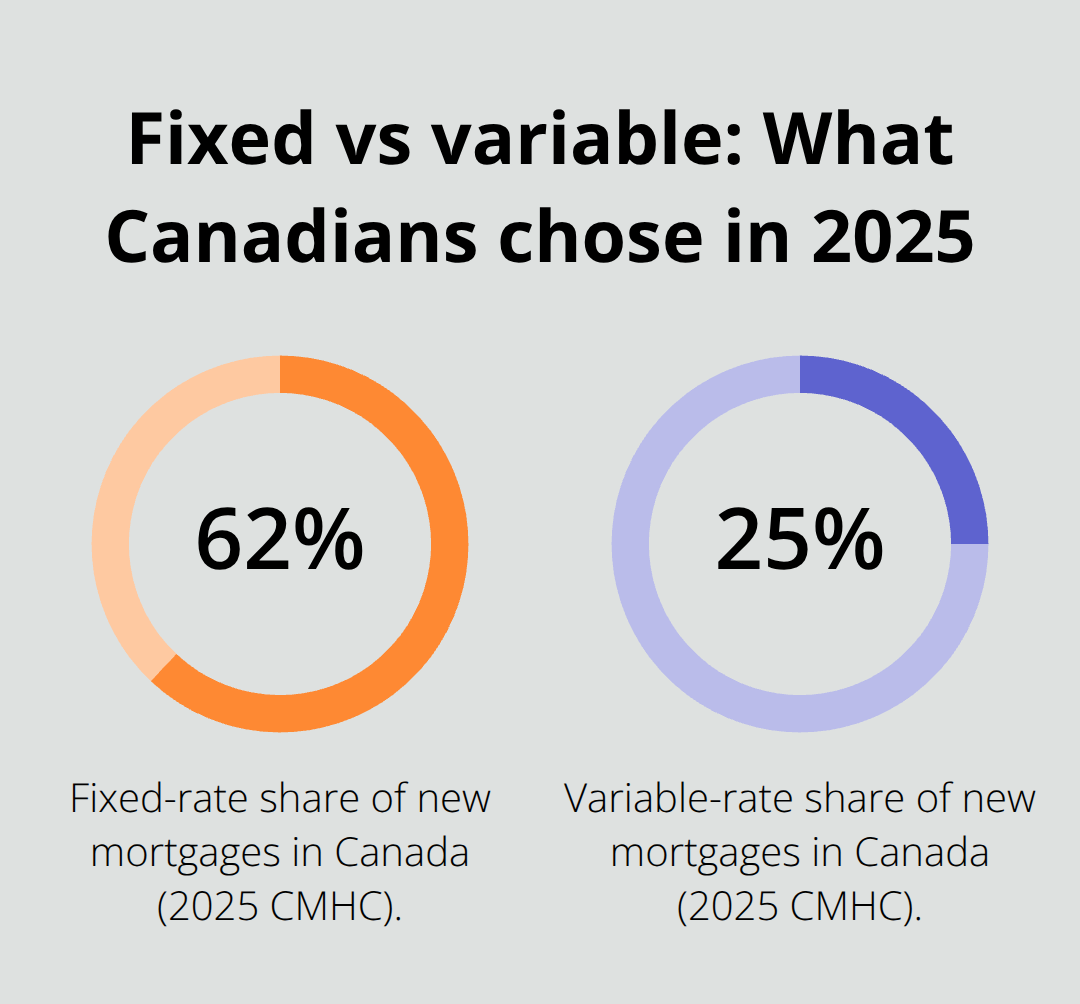
Fixed-rate mortgages dominate Canadian borrowing for a reason: they eliminate payment uncertainty. According to the CMHC Mortgage Consumer Survey from 2025, fixed-rate mortgages account for 62% of new mortgages, while variable-rate mortgages represent 25%. A fixed rate locks your payment for the entire term, whether that’s two years or ten years, so you know exactly what your mortgage costs regardless of what the Bank of Canada does next.
If rates climb another 1% after you lock in 3.94%, your payment stays frozen. This predictability matters most when your household budget is tight or when you plan to stay in your home long enough to benefit from rate stability.
Variable-rate mortgages currently sit at 3.25% for five-year terms, which undercuts fixed rates by 0.69%, but that discount disappears the moment the Bank of Canada cuts rates further or if future tightening occurs. The real decision hinges on your risk tolerance and timeline, not on which option is theoretically cheaper. If you lose sleep over payment fluctuations, fixed is non-negotiable. If you plan to sell or refinance within three to five years and can absorb a potential 1% payment increase, variable rates offer genuine savings right now.
Open vs Closed Mortgages
Open mortgages provide maximum flexibility but at a steep cost: they typically carry rates 0.50% to 1.00% higher than closed mortgages for identical terms. With an open mortgage, you can pay off your entire balance or make lump-sum payments without penalty, which appeals to borrowers who expect a windfall or plan to sell soon. Closed mortgages lock you into the lender’s terms and impose prepayment penalties if you pay beyond annual limits (typically 15% to 20% of the original balance) or if you refinance early.
However, closed mortgages offer rates that reflect the lender’s certainty, so you pocket that 0.50% to 1.00% savings every single month. For a $500,000 mortgage at 3.94%, that 0.50% difference equals roughly $208 per month or $2,496 annually. Most borrowers should choose closed mortgages and accept the prepayment restrictions because the rate savings far exceed the value of flexibility they’ll likely never use.
Short-Term vs Long-Term Rate Options
Shorter terms like one-year or two-year fixed mortgages currently show rates around 6.24% for six-month terms and 4.29% for one-year terms, which seem attractive but require renewal risk management. Every two to five years, you renegotiate with your lender or shop for a new one, and rates could be higher at that point. Longer terms eliminate this guessing game: five-year fixed at 3.94% locks your rate for sixty months, so you avoid four renewal conversations and the rate uncertainty that comes with them.
Short-term mortgages make sense only if you genuinely expect to sell, refinance, or significantly improve your financial position before renewal arrives. Five-year fixed mortgages remain the most competitive option across lenders because they balance rate certainty with reasonable term length. Your next step involves understanding which mortgage type aligns with your timeline and comfort level with payment changes, then testing that choice against actual lender quotes to see where your rate truly lands.
Comparing Rates Across Lenders Without Wasting Time
Most borrowers check one or two banks, see a rate quote, and assume that’s their best option. This approach costs thousands. The gap between the highest and lowest available rates for your exact profile regularly exceeds 0.50%, which on a $500,000 mortgage translates to $208 monthly or $2,496 annually. Rate comparison platforms update quotes multiple times daily, so yesterday’s best deal may no longer rank in the top three today.
Where to Find Real Rates, Not Posted Quotes
Ratehub.ca pulls rates from major lenders and updates them throughout the day, letting you see real pricing without visiting fifteen websites. Rates.ca accesses lenders across Canada and refreshes regularly, capturing alternative lenders and brokerages that undercut the Big Six banks consistently. The lowest insured 5-year fixed currently sits around 3.94%, but you only access that rate if you actually compare it against other lenders.
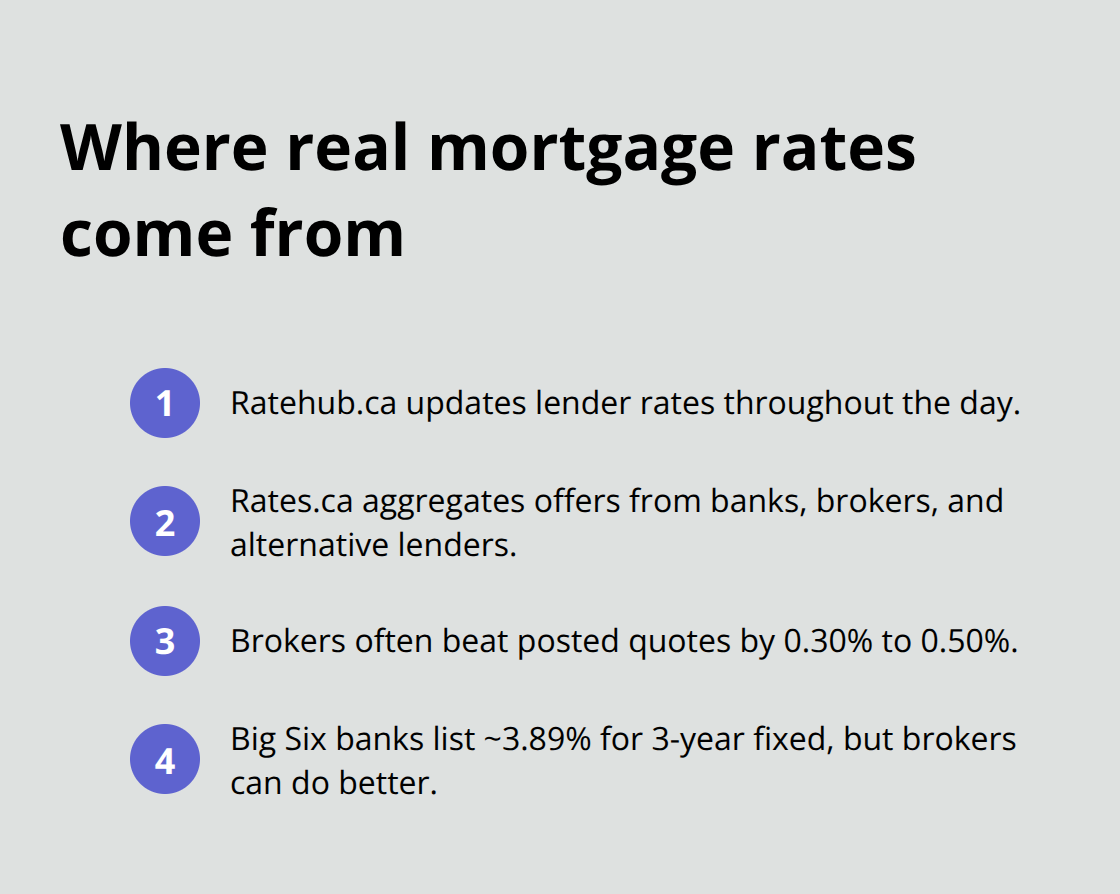
Big Six banks quote around 3.89% for 3-year fixed, yet brokers regularly offer 0.30% to 0.50% better. Mortgage brokers access rates directly from lenders and negotiate discounts you won’t find posted online, and their service costs you nothing since lenders pay them for funded mortgages.
How Your Profile Determines Your Actual Rate
Your credit score, down payment size, and employment stability determine your actual qualifying rate, not the advertised rates you see online. A borrower with a 680 credit score and 10% down receives a different quote than someone with a 750 score and 25% down, even from the same lender. Test your profile against at least three lenders before committing; one lender might offer 3.94% while another quotes 4.24% for identical circumstances, a difference worth $150 monthly on a $500,000 mortgage. Self-employed borrowers face stricter income verification and typically pay 0.25% to 0.75% more due to documentation complexity, so your tax returns and accounting records must be clean and consistent for two years prior.
The Stress Test and Borrowing Capacity
Your stress test qualifying rate determines actual borrowing capacity and often surprises borrowers. You must qualify at the greater of your contract rate plus 2% or 5.25%, which means a 3.94% mortgage requires you to qualify as though you’re paying 5.94%. This gap shrinks your approved amount significantly compared to what you might afford at the actual contract rate. When you approach renewal, lenders hold minimal obligation to keep your business, so you should shop aggressively at renewal time to capture real savings. Switching lenders at renewal involves minimal friction since stress test rules for uninsured mortgages have been adjusted. Insured mortgages were already exempt from renewal stress tests, making them easier to renew or switch.
Rate Holds and Prepayment Terms
Lock in a rate hold for 120 days after pre-approval so you control when you finalize your rate rather than watching it drift higher while you search for homes. Prepayment options vary by lender but typically include annual lump-sum payments around 15% to 20% of the original balance and the ability to increase regular payments without penalty. Verify these terms before committing since they affect your long-term flexibility. The difference between the best and worst available rates for your profile represents real money, so you should spend two hours comparing instead of accepting the first quote you receive.
Final Thoughts
The difference between the highest and lowest available rates for your profile regularly exceeds 0.50%, which translates to thousands of dollars over your mortgage term. Test your profile against at least three lenders using comparison platforms like Rates.ca, which updates multiple times daily and captures rates that undercut posted quotes significantly. Lock in a rate hold for 120 days after pre-approval so you control timing rather than watching rates drift higher while you search for homes.
When you compare mortgage rates Canada across different lenders, you protect your household budget from unnecessary costs and uncover real savings that posted rates never reveal. At renewal time, shop aggressively since lenders hold minimal obligation to keep your business, and switching lenders has become frictionless for uninsured mortgages. Verify prepayment options and annual lump-sum limits before committing, as these terms affect your long-term flexibility and ability to pay down your balance faster.
We at Financial Canadian believe that informed borrowers make better financial decisions and build stronger financial futures. Spend two hours comparing instead of accepting the first quote, and you’ll pocket the difference every single month for years to come. Visit Financial Canadian to explore how we can help you build a website that drives engagement and growth for your financial content.










Leave a comment