Credit Value Adjustment represents the market value of counterparty credit risk in derivative transactions. Banks worldwide now calculate CVA to price potential losses from counterparty defaults.
We at Financial Canadian break down a comprehensive Credit Value Adjustment example to show exactly how financial institutions quantify and manage this risk. This practical walkthrough covers the complete calculation process with real numbers.
What Makes CVA Different from Standard Credit Analysis
CVA Measures Real-Time Market Risk
Credit Value Adjustment transforms how banks price derivatives by capturing the actual market value of counterparty risk at any given moment. Traditional credit measures like credit ratings or loan loss provisions work with static assessments over fixed periods. CVA operates differently – it fluctuates daily based on market conditions, counterparty creditworthiness, and exposure levels.

The Basel Committee on Banking Supervision mandated CVA calculations after the 2008 crisis, when institutions lost significant amounts from counterparty defaults. Standard credit analysis examines historical default patterns, while CVA projects future exposure scenarios through Monte Carlo simulations that can run millions of calculations.
Banks Price Risk Into Every Trade
Financial institutions integrate CVA directly into derivative pricing because it represents real money at risk. When JPMorgan trades an interest rate swap with a corporate client, the bank immediately calculates how much the counterparty’s potential default could cost over the contract’s lifetime. This cost gets built into the trade price upfront.
Traditional credit measures typically apply after losses occur through provisions or write-offs. Major banks now incorporate CVA into their deal pricing, representing a dramatic shift from pre-2008 practices when clearing reforms were introduced for standardized derivatives.
CVA Desks Transform Risk Management
CVA desks at major institutions manage billions in exposure daily, adjusting positions as credit spreads widen or tighten. These specialized teams monitor counterparty risk across entire portfolios rather than individual trades. The approach shifts risk management from reactive loss recognition to proactive risk pricing.
Banks now treat CVA as a separate profit center, with dedicated traders who hedge counterparty exposure using credit default swaps and other instruments. This evolution fundamentally changes how derivatives markets operate and sets the foundation for understanding the specific calculation methods that quantify these risks.
How Banks Calculate CVA Components
CVA calculations require three fundamental components that work together to quantify counterparty risk: exposure at default, probability of default, and loss given default. The mathematical formula multiplies expected positive exposure by probability of default and loss given default, then discounts the result to present value.
Banks typically use a 40% recovery rate assumption, which means loss given default equals 60% for most corporate counterparties. The International Swaps and Derivatives Association found that actual recovery rates for derivatives range between 35-45%, which makes this standard assumption reasonable for most calculations.

Expected Positive Exposure Drives CVA Calculations
Expected positive exposure represents the average amount at risk if a counterparty defaults at any future point. Banks calculate this through Monte Carlo simulations that generate thousands of market scenarios and measure potential contract values under each scenario.
Interest rate swaps show the highest EPE during mid-life periods when rate movements create maximum value volatility. Financial institutions invest large amounts of resources employing Monte Carlo simulation to measure and price their counterparty credit risk.
Banks update EPE daily because market movements constantly change exposure profiles. This makes EPE the most dynamic component of CVA calculations and requires sophisticated technology infrastructure to process the massive computational requirements.
Default Probabilities Come from CDS Market Data
Risk-neutral default probabilities derive from credit default swap spreads rather than historical default rates because CVA requires market-based pricing. When credit spreads are observed in the market, then risk-neutral default probabilities are derived from those observations.
Moody’s data shows real-world default probabilities for Aaa-rated companies average 4 basis points annually, while market-implied probabilities from CDS spreads average 67 basis points for the same credits. This massive difference reflects market risk premiums and explains why CVA charges often exceed historical loss experience.
Banks prefer CDS-derived probabilities because they capture current market sentiment and price volatility that historical data misses. These market-based inputs feed directly into the practical calculation examples that demonstrate how institutions apply these components to real derivative transactions.
Real-World Credit Value Adjustment Example
Trade Setup and Risk Parameters
Deutsche Bank enters a 5-year interest rate swap with ABC Manufacturing, where the bank pays a fixed rate of 3.5% and receives floating SOFR payments on $10 million notional. ABC Manufacturing carries a BBB credit rating with CDS spreads at 150 basis points, which translates to a risk-neutral default probability of 2.4% annually based on Bloomberg market data. The bank applies a 60% loss given default rate, consistent with International Swaps and Derivatives Association recovery statistics for corporate counterparties.
Monte Carlo simulations process 50,000 interest rate scenarios to calculate expected positive exposure over the swap’s lifetime. The model identifies peak exposure in year 3 at $425,000, with average expected positive exposure across all time periods at $280,000. These exposure calculations incorporate interest rate volatility of 85 basis points annually and include netting benefits from other trades with the same counterparty.
CVA Calculation Mechanics
The CVA calculation multiplies the expected positive exposure of $280,000 by the annual default probability of 2.4% and the loss given default rate of 60%. This produces an annual CVA charge of $4,032 per year. The bank discounts this amount over the 5-year term at the risk-free rate of 2.8%, which yields a total present value CVA of $18,450 for the entire transaction.
Impact on Trade Pricing
Banks add this CVA charge directly to swap prices, which increases the fixed rate the client pays by approximately 3.7 basis points to cover the counterparty risk premium. Major institutions like JPMorgan and Goldman Sachs now incorporate these calculations into every derivative trade. This practice fundamentally changes how banks price and manage counterparty exposure in the post-2008 regulatory environment where CVA capital requirements enhance counterparty credit risk management.
Final Thoughts
This Credit Value Adjustment example shows how banks transformed derivative pricing after 2008. Financial institutions now calculate CVA on every trade and add counterparty risk premiums that range from 2-15 basis points depending on credit quality and exposure profiles. CVA implementation changed risk management practices across global markets fundamentally.
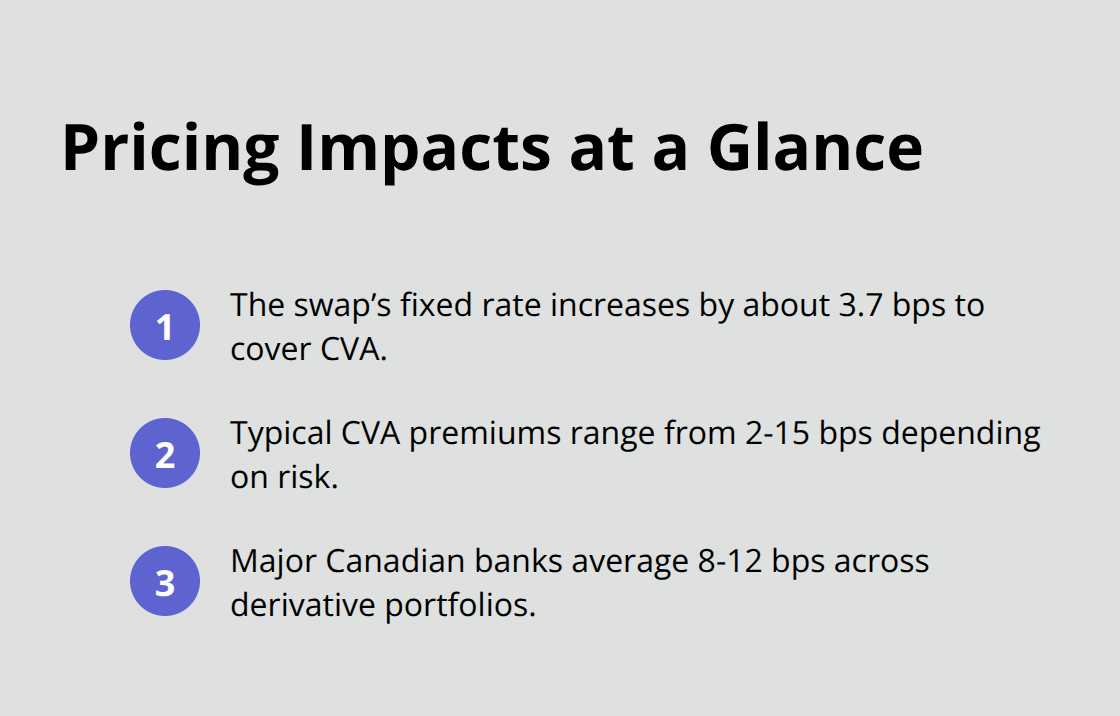
Banks shifted from reactive loss recognition to proactive risk pricing and created specialized CVA desks that manage billions in exposure daily. The Basel III framework requires banks to hold capital against CVA volatility, which makes accurate calculations essential for regulatory compliance. Canadian financial institutions benefit from robust CVA frameworks, with the Bank of Canada reporting that major Canadian banks maintain CVA charges that average 8-12 basis points across their derivative portfolios.
Modern CVA calculations require sophisticated technology infrastructure and specialized expertise. Banks invest heavily in Monte Carlo simulation capabilities and real-time risk monitoring systems to stay competitive in derivative markets. We at Financial Canadian help financial institutions establish strong digital foundations through our comprehensive web design service that supports complex risk management operations with responsive platforms tailored to specific business requirements.


Leave a comment